“What we see is not always what exists.” Just to begin with, when you invest your money in Fixed Deposit (7% p.a.), your money will grow at rate of 7% in a year. The same money, if you would have put in Nifty it will grow at CAGR of 10.56% (NIFTYBEES ETF 10 years rolling returns average after all costs and taxes). The same money, put it in some very profitable business say setting up Cake Shop will earn you returns of 20% p.a.
But, is FD returns, NIFTYBEES returns and Cake Shop returns are seen in the same way as it looks? Definitely not, because there is something more to it. Consider that, you have been given an option to invest in Nifty which will give you returns of 10.56%, and other options being 3 businesses which will give you return % as below:
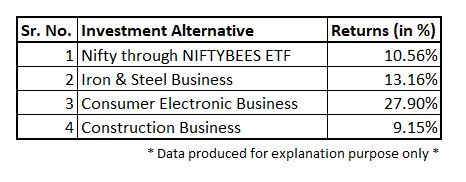
Here, you can clearly see that, returns generated in business of Construction is lowest when compared with highest returns of Consumer Electronic business. So, when one is given a choice to invest their money in any of these four investment alternatives, he will definitely chose Consumer Electronic Business. But, even other alternatives are not bad considering the F.D returns of 7%. Each of the investment alternatives are superior then the returns given by Fixed Deposit. But again, it is not the way it looks and there is something more to it!
If, the risky business you invest in does not produce bare minimum return of 10.56% (somewhat comparable with NIFTYBEES ETF riskiness), then the best thing you should do is to sit, relax and make no efforts, just press buy button on NIFTYBEES ETF to earn 10.56%. It sounds very logical and simple. When you put efforts, venture in business, and work for elongated periods of time, do all the hard work and still be able to earn what Nifty earns, all your activity is just useless unless you have some other motives to run the business. This is what, has been explained by me in my previous post of “Opportunity Cost”.
So, when your business earns fairly higher than Nifty returns of 10.56%, you are better off doing business. This return of 10.56% is arrived by historically analysing Nifty Returns from 2002 i.e. averages of 10 year rolling returns gives you this 10.56%. Hence, there is logical base set for 10.56% which will help us in understanding Economic Profit (E.P).
Economic Profit % is “The extra returns we earn, which is over and above the next best alternative.”
Hence, here our base set is 10.56%, which can also be called as Opportunity Cost. Hence, when we invest in any form of alternatives, what we should earn minimum is 10.56%, if not then investing in Nifty is the best alternative available. And, whatever we earn over and above this Nifty Returns of 10.56% it is called as our Economic Profit.
So, the next time when you are given the choice of investing in business and the returns from any business is below 10.56% you have basically lost money. Yes, Loss, and Economic Loss is the correct interpretation. When you have choice to invest in 10.56% returns generating NIFTYBEES ETF and your Construction Business is only giving you 9.15%, then you have not earned 9.15% in your Construction Business but rather lost -1.41% of extra and attainable returns.
Therefore, whenever you have investment alternatives which are risky, always compare with the Opportunity Cost of investing in alternate source i.e. here, NIFTYBEES. And, whenever you earn returns % above NIFTYBEES ETF, this is actually what have you earned in real sense, the Economic Profit.
Hence, the Economic Profit of businesses over the NIFTYBEES ETF returns of 10.56% is given in the table.  And here you can see, Iron & Steel Business only have marginal E.P whereas Consumer Electronic business is a very great venture to get into. Also, Construction Business is actually a loss making effort. And so, next time you have been given a choice to invest in any of the business anywhere, you will make sure you earn the bare minimum return of 10.56%, or do not venture into business at all.
RESEARCH:
To base my above explanation with the actual facts, I have come up with detailed research on 6 Industries as categorised by BSE India. I have picked up almost all the companies with Market Capitalization of above 100 Cr. in each of these 6 industries and calculated their Economic Profit. Also, I have calculated the Average Industry Economic Profit on simple as well as weighted average basis. (All excel sheets attached)
Before running you through the research, I would like to first explain you what has been considered by me in my diligent course of research:
- Using ROCE as Returns in a Business.
ROCE (Returns on Capital Employed) have been considered to find the returns earned by the businesses.
>>>ROCE = EBIT (1 – tax rate) / (Debt + Equity)
ROCE is calculated using how much company have earned (EBIT) w.r.t how much company have put in (Debt + Equity). Hence, how much returns has the company generated? This is calculated using ROCE. Where ROCE have removed the effect of different capital structures (i.e. ratio of Debt & Equity), it takes all the operations into account i.e. Core and Non-Core (merged in EBIT). Hence, it still does not remove the effect of non-core operations of business.
Whereas some might argue to take ROE (Returns on Equity) and/or ROIC (Returns on Invested Capital) as proxy to returns of a business, for data complexity and vast amount of research conducted, ROCE is taken as best proxy. ROCE is still the closest proxy to ROIC when more of the operations of company are into core businesses. I am explaining you ROE and ROIC for understanding purpose.
ROE i.e. return on Equity states how much Shareholders have earned? Hence, removing all the taxes, interest, etc. the final amount leftover is the amount that they have earned.
>>>ROE = Profit after Tax / Equity
Hence, if a company has very high debt and low equity comparatively, then the ratio of ROE will be very high. And so we conclude that ROE does not eliminate the difference of capital structure as well not takes into account the Core Operations.
ROIC i.e. returns on invested capital is generally the best way to judge how much the core business of the company has generated.
>>>ROIC = (EBIT – Other Income) (1 – t) / (Fixed Assets + Working Capital)
ROIC will give us only the returns generated by business (i.e. EBIT – Other Income which is non-core) and the amount invested in core operations (i.e. Fixed Asset and Working Capital.) Hence, ROIC removes capital structure as well as only considers Core operations of business.
Where I have only taken ROCE, I have put in ROE and ROIC as well in my research sheet. You can choose as per your suitability and easily arrive at the returns earned by business.
- Using WACC for Opportunity Cost of Capital:
Where I have explained you minimum 10.56% returns as base for opportunity cost, company who are using too much debt can actually get loan at lower rates. Hence, they still earn economic profit if the loan interest rate is less then returns earned by these businesses. Hence, WACC is taken as the best proxy for Opportunity cost of capital. Note that, in case if the industry on whole works on Equity and minimal debt, 10.56% is the best proxy for opportunity cost. To maintain consistency across my research I have used WACC (Weighted Average Cost of Capital adjusted for taxes) as proxy for opportunity cost.
>>>WACC = 10.56% * (Equity / Total Weight) + Int. % * (Debt / Total Weight)
Where, the weight in equity is dominant in any company, the WACC will closely reflect to 10.56%, and where there is too much of debt in any industry the WACC will closely reflect the interest % on borrowings.
One can also take a flat of 10.56 % as NIFTYBEES ETF returns or even directly take Interest % as proxy of Opportunity cost. But, as explained above i.e. due to capital structure difference between debt and equity, WACC is the best proxy. And again here, I have kept an option to choose between Interest borrowing % as well as NIFTYBEES Returns % as per suitability of the researcher.
- Finding Economic Profit:
As you know now, Economic Profit = Business Returns – Opportunity Cost.
Here in my research: E.P = ROCE of Business – WACC of Business.
I have conducted extensive research by extracting out all the companies with market cap of above 100 Cr. in the 6 industries I have selected. For all the companies (except few, where data was not available), I have taken out E.P of each year from 2010 to 2019. Then, average of each companies E.P from 2010 to 2019 was calculated. These average industries E.P was calculated in two ways i.e. Simple and Weighted as explained to you below:
Simple Average E.P. – It is simply the average of all the companies average E.P. Hence, all companies average E.P for long term (2010-2019) was calculated and an average of EP’s of all these companies were taken out. The resultant average E.P is termed as Industries Simple Average Economic Profit.
Weighted Average E.P. – Average was taken out based on ratio of average Capital Employed (Debt + Equity) of each companies. Hence, simple average of historical capital employed (From 2010-2019) was taken out for all the companies in an industry. Then, total of these average Capital Employed were found out and each companies were given weights as % of total capital employed (Self-explanatory in excel sheet attached). Then, the average E.P found of each companies were multiplied with these weights to find Weighted Average E.P of each Companies. These Weighted Average E.P of each companies were totalled to get Industry’s Weighted Average Economic Profit.
- Important Disclaimer:
I have taken 6 industries and total of 80 Companies for my research. All the financial data has been directly taken from one website i.e. www.screener.in Data pertaining to Borrowings, Equity, Interest, EBIT and Fixed Assets are verified from Annual Report on Test Check Basis. Where ever necessary, the data is adjusted/edited to avoid any unrealistic ratios, percentages and amounts. The data taken, has been adjusted at certain areas to the best of my ability to get the true picture of E.P. All other important and useful calculations, disclaimers, etc. have been explained in my sheet itself.
- Result:
The six industries which I have considered for my research are:
- Iron & Steel Industry
- Non-Ferrous Metals
- Copper
- Containers & Packaging
- Consumer Electronics, and
- Construction & Engineering
All the companies within these industries are taken from Industry Watch data of BSE India.
I have shown analysis of Simple and Weighted Average E.P findings of “Iron and Steel” industry. All the other industries analysis goes on similar lines and hence only the final conclusion is made in the end. There are total of 13 companies with market cap above 100 Cr. in the whole Iron and Steel industry. All the relevant excel calculations are uploaded in google drive and the link is shared at the end. So, the findings of Industry Simple Average E.P and Industry Weighted Average E.P are:
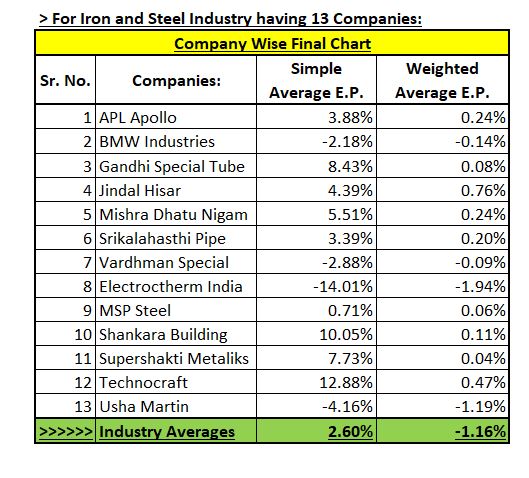
We see here that, Simple Average E.P is standing at 2.60% which is only marginally higher than our opportunity cost of capital. Also, when we observe data carefully we see Electroctherm India has very high negative E.P of – 14.01%. The reason is that, this company has negative equity and also operating on very high debt. Hence, when we remove this outlier our Simple Average E.P. comes to 3.98%. Where we can adjust the outliers, even if we consider all the companies, we see positive E.P being generated. Also, when we see few very good performing companies, the E.P is as high as 5% to 12%. Hence, one might even conclude that efficiency with which these companies operate has an important role to play in overall E.P of the companies.
You can also see a snapshot of my sheet containing calculation like ROCE, WACC, EP, Capital Employed and D/E Ratio for APL Apollo Tubes Limited. All these are required for some quick assertions regarding companies’ performance over time. Like, here in APL Apollo Tubes Ltd. You can see that D/E ratio is continuously being lowered indicating repayment of debt. Hence, many necessary conclusions can be made at the face of the sheet itself.

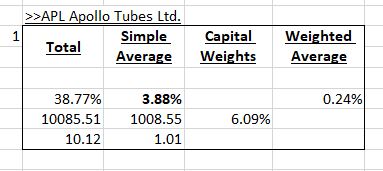
For each companies, you can see Simple Average E.P Calculations, Average D/E ratio over 10 year, Capital Weights and Weighted average E.P. Here, you can see that simple average E.P. of APL Apollo tubes is at 3.88% and it contributes 0.24% in total Weighted Average E.P.
This was done for all the 13 companies in Iron and Steel industry (and obviously for all six industries I have selected). And the final result is given in the table.
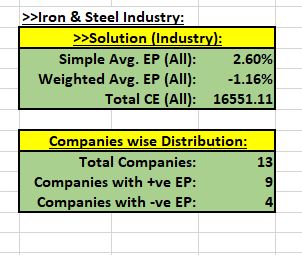
There are 9 companies out of 13 which has positive E.P. Hence, the probability that in this industry, the company which may became Economically Profitable is higher. Hence, although E.P is only marginally higher, the chances of investing in the right company which earns positive E.P is higher.
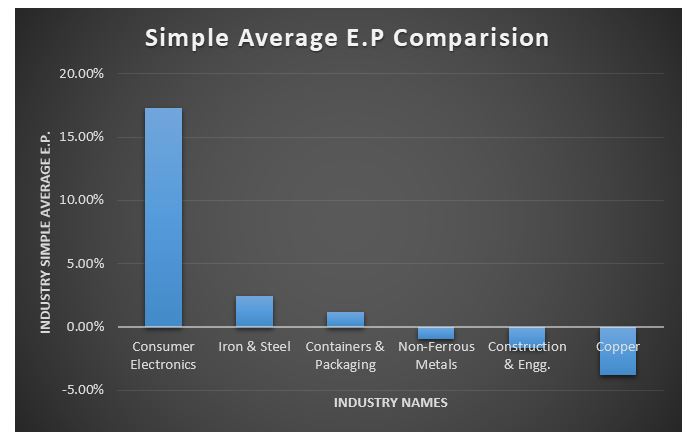
So, just imagine the Consumer Electronics business where E.P is as high as 17%.

You will observe here that 7 out of 8 companies turn out to be extremely profitable. Hence, when you go and invest in these companies, there is very high probability that your investment will perform fairly. Hence, what matters the most is selecting right business to invest our money. When we select right business with higher E.P, chances that we catch the right fish (i.e. companies with higher returns) are even higher.
A chart representation of companies Simple Average E.P of Iron and Steel Industries.

Conclusion:
Hence, selecting industries with higher Economic Profit gives you higher probability of investing in companies which will also enjoy higher E.P’s. Investing in industries which are not even earning a marginal E.P might seem illogical as, why one would put money in business that is not even making minimum profit. Obviously, there can be turnaround in those companies or some other ideology, but that requires vigorous amount of knowledge and research which is an expert’s job. But, when you want to invest in any companies, the first thing which you want to look is that it enjoys profitability. And to select right company for your research and then investment, it starts with right industry with good E.P.
I have compiled the data of all the six industries and found out the Simple Average E.P’s of industry as a whole. You might want to see it:
I have uploaded all my calculation and excel sheets. You can click here for a google drive link of all sheets.
All work is performed by me as per the best of my understanding. Relevant adjustments in the data like segmented data, some manual entries to filter irregular data, etc. have been performed by me. These sheets might contain some error or irregularities. What I can only assure you that, the conclusion arrived will closely match with the in depth analysis of each of the respective companies.
If you find any error worth attention and is very impactful, do let me know so that I can do the adjustments and update the sheets. Also, do not consider any data or explanation as my investment advice.
Thank You for your kind attention!
Pingback: Why Steel? And begning with Steel sector. – Wittiest Investing
Pingback: 7. Profit Pool Analysis of Steel Sector. – Wittiest Investing
Pingback: 21. Understanding Historical Demand-Supply cycles in Domestic Steel Pipes & Tubes segment. – Wittiest Investing
Pingback: 17. What Opportunity Market Steel Pipes & Tubes Segment has, and its importance. – Wittiest Investing
Pingback: 9. Understanding Porter’s Five Force and an analysis of Steel Pipes & Tubes’ Porter – Wittiest Investing