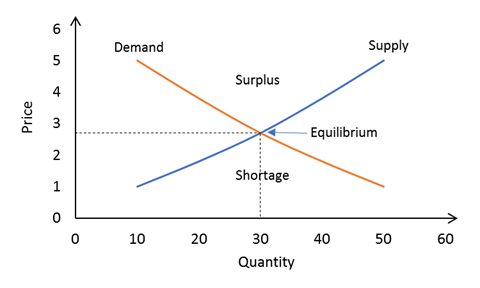
Demand-Supply mechanism is a core part of economics which determines the price of commodity. Higher demand with limited supply leads to better price realizations. Thus, we analyse supply capacity with capacity utilization (i.e. proxy to demand) and understand how profitability have impacted. When we talk about profitability, in a cyclical business they come easy during uptrend in cycles and vice versa. Hence, during the course of our analysis, we will understand how long the cycles have been for pipes & tubes segment, how long they are expected to run from current levels and how the profitability have moved over the years. Let us start by analysing few simple charts:

Look at the data points used (Source Link Here):

Steel Pipes & Tubes segment’s average E.P. and Average Capacity Utilization have been plotted in the above chart. Looking at above chart, it is not clear how the profitability have impacted due to capacity utilizations. However, what to observe is from 2015 onwards, the average capacity utilization levels have jumped significantly. With higher capacity utilizations, we also see slight jump in economic profitability in recent years.
But, the above chart is of whole industry. We cannot conclude meaningfully unless we understand each of the product category because dynamics of each of product category vary. Hence, look at all the charts below, an analysis product category wise.

There is direct correlation of capacity utilization and positive economic profit for Seamless Pipes & Ratnamani Metals (all product categories). For SAW Pipes namely Welspun Corp. and Man Industries, the profitability have been down for many years. The lower profitability is mainly due to company specific issues of product mix for Welspun Corp. and issue of corporate governance for Man Industries. We do not find any meaningful conclusions for ERW Pipe i.e. APL Apollo, but we do see positive economic profitability across years.
Apart from all the above, we find one common traits i.e. for recent years the capacity utilization have been higher. Barring APL Apollo (due to capacity extension leading to lower utilizations), all other companies and product categories are experiencing good traction leading to higher capacity utilizations. Also, the E.P have been rising for past few years. This is seen as a good sign for our industry going forward.
Through the charts, due to up and down cycles in E.P, we see that Steel Pipe & Tubes business is cyclical. However, to note is that Steel Pipes & Tubes is just an intermediately industry facilitating other huge industry to serve to its direct final users. Hence, steel pipes & tubes industry is experiencing cyclicality only due to the cycles faced by the user industry. Due to lack of Capital Expenditure by application industry, the demand for Steel Pipes & Tubes remained low. However, as we understood in Opportunity Size and Tailwind of Sector, there is huge investment being planned for future by GOI. This all will act as catalyst to Steel Pipes & Tubes Industry and for mid to long term (mostly up to the year 2025) the cycles are expected to improve leading to higher capacity utilizations and higher profitability.
The above stance is also justified by understanding companies which are currently having expansion plans. This indicates that, in their view the prospect for demand in future will be higher. Check out expansion plans of companies in this segment:

Maharashtra Seamless & Ratnamani Metals have expansion plans currently. APL Apollo too had expansion plans but they have delayed for 2 years due to COVID and demand uncertainty. It is justified for APL Apollo to expand as their own capacity utilization is very high (actually, highest) for the current period. Hence, they themselves see a good demand for their products and hence they are going for expansion plans. This also states that, the prospect for higher demand in future is good and the same also coincides with our Opportunity Size calculation.
Also, what we observe is that, with higher utilization levels there is higher E.P. We can see the same in years 2019 & 2020. So, in future as projected, capacity utilization level will be even higher leading to better E.P. across companies.

Therefore, there are many points which are coming up with which we can expect that the best of the industry is coming very soon:
- Higher capacity utilization levels for latest 2-3 years.
- Higher Economic Profitability as well.
- Capacity expansion plans for few good companies in the segment.
- The prospect of future is very good, which is calculated through Opportunity Size.
Hence, from all the above points, with higher profit, higher utilization levels and possible upturn in cycles, it is giving a very good indication regarding higher revenue growth in future followed by profitability.
I hope you like the analysis explained above. Do put in comments if I have missed any points. Thank You All!!
Source: Find the link of Excel Sheet for all calculation relating to Cyclicality Analysis.
Disclaimer: Views are personal and presented through independent research. By no means there is any stock advice. Also, presented content is for learning purpose only. I might be wrong in presenting data and inaccurate data, let me know if you find any discrepancies.

Pingback: 24. Risk or Headwinds? What our segment has faced? – Wittiest Investing
Pingback: 26. A Recap of why we selected Ratnamani Metals & Tubes Limited as our core company. – Wittiest Investing